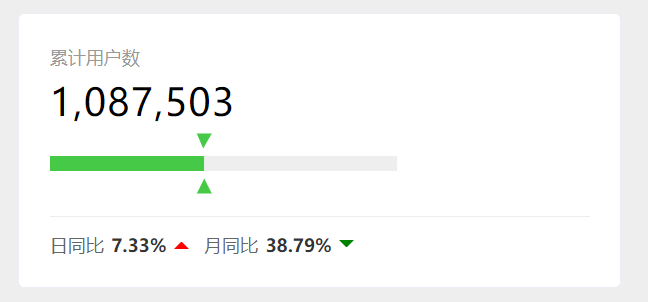
请稍等 ...
×

采纳答案成功!

向帮助你的同学说点啥吧!感谢那些助人为乐的人

请问为什么我的柱状图无法填满容器

图片描述

<template>
    <div>
        <common-card title="累计用户数" value="1,087,503">
            <template>
                <div id="total-users" :style="{ width: '100%', height: '100%' }"></div>
            </template>
            <template v-slot:footer>
                <div class="context">
                    <span>日同比</span>
                    <span class="money">7.33%</span>
                    <div class="increase" style="margin-right:10px" />
                    <span>月同比</span>
                    <span class="money">38.79%</span>
                    <div class="decrease" />
                </div>
            </template>
        </common-card>
    </div>
</template>

<script>
import commonCardMixin from '@/utils/mixins/commonCardMixin'
export default {
    mixins: [commonCardMixin],
    mounted() {
        const chartsDom = document.getElementById('total-users');
        const charts = this.$echarts.init(chartsDom);
        charts.setOption({
            xAxis: {
                type: 'value',
                show: false,
            },
            yAxis: {
                type: 'category',
                show: false,
            },
            grid: {
                top: 0,
                left: 0,
                bottom: 0,
                right: 0
            },
            series: [
                {
                    type: 'bar',
                    stack: '总量',
                    data: [200],
                    barWidth: 10,
                    itemStyle: {
                        color: "#45c946"
                    }
                },
                {
                    type: 'bar',
                    data: [250],
                    stack: '总量',
                    itemStyle: {
                        color: "#eee"
                    }
                },
                {
                    type: 'custom',
                    data: [200],
                    stack: '总量',
                    renderItem: (params, api) => {
                        const value = api.value(0)
                        const endPoint = api.coord([value, 0])
                        return {
                            type: 'group',
                            children: [{
                                type: 'path',
                                shape: {
                                    d: 'M0 767.909l512.029-511.913L1024 767.909 0 767.909z',
                                    x: -5,
                                    y: 10,
                                    width: 10,
                                    height: 10,
                                    layout: 'cover'
                                },
                                position: endPoint,
                                style: {
                                    fill: '#45c946'
                                }
                            },
                            {
                                type: 'path',
                                shape: {
                                    d: 'M1204 255.996 511.971 767.909 0 255.996 1024 255.996z',
                                    x: -5,
                                    y: -20,
                                    width: 10,
                                    height: 10,
                                    layout: 'cover'
                                },
                                position: endPoint,
                                style: {
                                    fill: '#45c946'
                                }
                            }],

                        }
                    }
                },
            ]
        })
    }
}
</script>
<style>
.context {
    display: flex;
    align-items: center;
}
</style>

正在回答 回答被采纳积分+3

2回答

慕容3226017 2022-08-06 19:35:12
我的也是这样
0 回复 有任何疑惑可以回复我~
路途坎坷 2022-07-01 21:52:19

最新版的堆叠我是用的barGap: '-100%',来做的,感觉stack有点问题,你可以试试

0 回复 有任何疑惑可以回复我~
问题已解决,确定采纳
还有疑问,暂不采纳
意见反馈 帮助中心 APP下载
官方微信