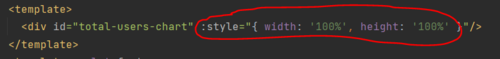
堆叠的柱状图怎么填满整个容器的宽度的?
老师的示例里就是填满的,我照搬的却右边长度不够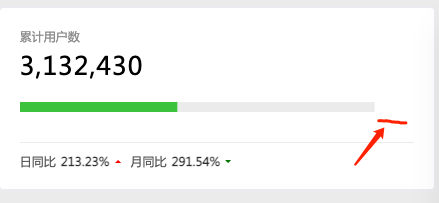
chart.setOption({
      xAxis: {
        type: 'value',
        show: false
      },
      yAxis: {
        type: 'category',
        show: false
      },
      series: [{
        type: 'bar',
        stack: 'total',
        data: [200],
        barWidth: 10,
        itemStyle: {
          color: '#45c946'
        }
      }, {
        type: 'bar',
        stack: 'total',
        data: [250],
        itemStyle: {
          color: '#eee'
        }
      }],
      grid: {
        top: 0,
        right: 0,
        bottom: 0,
        left: 0
      }
    })
840
收起
正在回答 回答被采纳积分+3
5回答


相似问题
堆叠柱状图
1186
0
3


关于容器宽度变化的疑问
705
0
3


请教一下老师,为什么我的柱状图宽度没有撑满父容器呢?
919
0
2
请问为什么我的柱状图无法填满容器
689
0
2


我的a-card为什么只有这么大
817
0
3


登录后可查看更多问答,登录/注册