请稍等 ...
×

采纳答案成功!

向帮助你的同学说点啥吧!感谢那些助人为乐的人

不显示结果

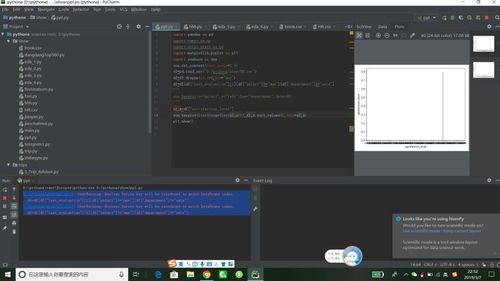
为什么在分组分析运行示例程序是,不显示图
import pandas as pd
import numpy as np
import scipy.stats as ss
import matplotlib.pyplot as plt
import seaborn as sns

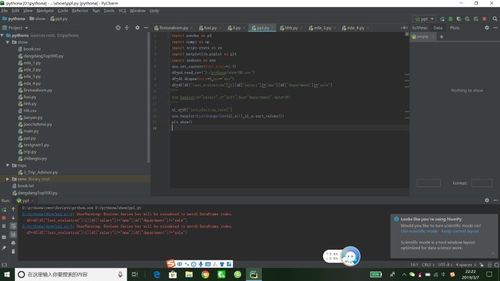
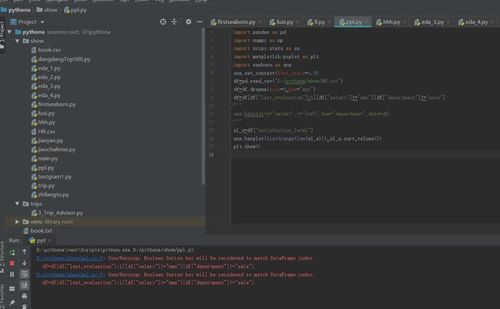
df=pd.read_csv(“D:/pythona/show/HR.csv”)
df=df.dropna(axis=0,how=“any”)
df=df[df[“last_evaluation”]<1][df[“salary”]!=“nme”][df[“department”]!=“sale”]

“”"
sns.barplot(x=“salary”,y=“left”,hue=“department”,data=df)

“”"
sl_s=df[“satisfaction_level”]
sns.barplot(list(range(len(sl_s))),sl_s.sort_values())
plt.show()

正在回答 回答被采纳积分+3

6回答

提问者 weibo_无法复制的w_0 2019-03-07 22:55:14


https://img1.sycdn.imooc.com//szimg/5c8130600001749d08000449.jpg
老师,我加了data=sl_s后倒是有图了,就是这样了,但是这个图肯定是有问题的

0 回复 有任何疑惑可以回复我~
  • 途索 #1
    这个恐怕我得试试了。数据没问题的话,可能得配置下。回头告诉你。
    回复 有任何疑惑可以回复我~ 2019-03-07 22:59:50
  • 嗯嗯 好的,谢谢老师
    回复 有任何疑惑可以回复我~ 2019-03-07 23:07:19
  • 途索 #3
    我试了下,是可以的。。。要不要设置下,把sci-view去掉,在view tool window下。
    回复 有任何疑惑可以回复我~ 2019-03-09 10:01:27
途索 2019-03-07 22:48:57

麻烦把warning也发我下吧

0 回复 有任何疑惑可以回复我~
  • D:/pythona/show/ppl.py:9: UserWarning: Boolean Series key will be reindexed to match DataFrame index.
      df=df[df["last_evaluation"]<1][df["salary"]!="nme"][df["department"]!="sale"]
    D:/pythona/show/ppl.py:9: UserWarning: Boolean Series key will be reindexed to match DataFrame index.
      df=df[df["last
    回复 有任何疑惑可以回复我~ 2019-03-07 22:50:44
提问者 weibo_无法复制的w_0 2019-03-07 22:23:41


https://img1.sycdn.imooc.com//szimg/5c812960000100cb08000449.jpg
老师,全图在这里

0 回复 有任何疑惑可以回复我~
途索 2019-03-07 22:15:54

同学你好,看下电脑屏幕最下面有没有可以点开的新窗口,那个就是图了。

0 回复 有任何疑惑可以回复我~
提问者 weibo_无法复制的w_0 2019-03-07 22:12:07


https://img1.sycdn.imooc.com//szimg/5c8126a10001f34c07990493.jpg
感觉程序在后台运行,但是没有结果

0 回复 有任何疑惑可以回复我~
途索 2019-03-07 21:53:59

同学你好,代码看不出什么问题,能把运行的状态截图发我么?

0 回复 有任何疑惑可以回复我~
问题已解决,确定采纳
还有疑问,暂不采纳
意见反馈 帮助中心 APP下载
官方微信