G2图表里的TITLE不显示
老师的代码运行出来是这样的,好像没有宽高:

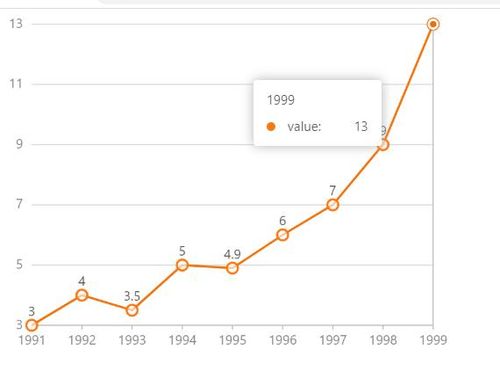
给DIV添加了宽高以后,图表要以显示,但标题还是出不来:
<!DOCTYPE html>
<html>
<head>
    <meta charset="utf-8">
    <script src="https://unpkg.com/@antv/g2plot@latest/dist/g2plot.min.js"></script>
    <style>
        #g2-chart{
            width: 400px;
            height: 300px;
        }
    </style>
</head>
<body>
<div id="g2-chart"></div>
<script>
    const data = [
        { year: '1991', value: 3 },
        { year: '1992', value: 4 },
        { year: '1993', value: 3.5 },
        { year: '1994', value: 5 },
        { year: '1995', value: 4.9 },
        { year: '1996', value: 6 },
        { year: '1997', value: 7 },
        { year: '1998', value: 9 },
        { year: '1999', value: 13 },
    ];
    // const chartDom = document.getElementById('g2-chart');
    const line = new G2Plot.Line('g2-chart', {
        title: {
            visible: true,
            text: 'g2折线图示例'
        },
        description: {
            visible: true,
            text: '折线图示例,这是一个副标题'
        },
        data,
        xField: 'year',
        yField: 'value',
        point: {
            visible: true,
            size: 5,
            color: '#fff',
            style: {
                stroke: '#fe740c',
                lineWidth: 2,
                fillOpacity: 0.6
            }
        },
        label: {
            visible: true
        },
        color: '#f2740c',
        yAxis: {
            formatter: (v) => {
                return `${v}k`;
            }
        }
    });
    line.render();
</script>
</body>
</html>
该如何解决?
5774
收起
正在回答 回答被采纳积分+3
1回答

相似问题
G2图表里的单位不显示
1293
3
1


老师,为什么我不显示图片??
1417
0
4


移动端里面v-html解析一条数据里面的图片移动端不显示?
3499
0
21


如何将爬取图片jpg文件写入csv显示出来
1070
0
2


显示本地图片,真机不能显示
1592
0
6


登录后可查看更多问答,登录/注册