基于 chapter9_task_dat_train 数据,建立 rnn 模型,预测贵州茅台次日股价。
1、完成基本的数据加载、可视化工作;
2、数据预处理:将数据转化为符合 RNN 模型输入要求的数据;
3、建立 RNN 模型并训练模型,计算训练集、测试集模型预测 r2 分数;
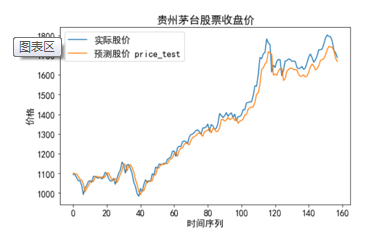
4、可视化预测表现;
5、将测试数据 (chapter9_task_data_test.csv) 预测结果保存到本地 csv 文件
提示:
模型结构:单层 RNN,5 个神经元;次使用前 10 个数据预测第 11 个数据,素材参见 git
【学习任务】贵州茅台股价预测
1.7k
等25人参与
全部作业
#load the data
import pandas as pd
import numpy as np
data = pd.read_csv('chapter9_task_data_train.csv')
price = data.loc[:,'close']
price.head()
- 1
- 2
- 3
- 4
- 5
- 6
- 1
- 2
- 3
- 4
- 5
- 6
代码块
复制 预览
代码块
复制 预览
#归一化
price_norm = price/max(price)
price_norm.head()
- 1
- 2
- 3
- 1
- 2
- 3
代码块
复制 预览
代码块
复制 预览
#define a method to extract x and y
def extract_data(data,time_step):
x = []
y = []
for i in range(len(data)-time_step):
x.append([a for a in data[i:i+time_step]])
y.append(data[i+time_step])
x = np.array(x)
x = x.reshape(x.shape[0],x.shape[1],1)
y = np.array(y)
return x,y
- 1
- 2
- 3
- 4
- 5
- 6
- 7
- 8
- 9
- 10
- 11
- 12
- 1
- 2
- 3
- 4
- 5
- 6
- 7
- 8
- 9
- 10
- 11
- 12
代码块
复制 预览
代码块
复制 预览
time_step = 10
x,y = extract_data(price_norm,time_step)
print(x.shape,y.shape)
- 1
- 2
- 3
- 1
- 2
- 3
代码块
复制 预览
代码块
复制 预览
#establish RNN model
from keras.models import Sequential
from keras.layers import Dense,SimpleRNN
model = Sequential()
model.add(SimpleRNN(units=5,input_shape=(time_step,1),activation='relu'))
model.add(Dense(units=1,activation='linear'))
model.compile(optimizer='adam',loss='mean_squared_error')
model.summary()
- 1
- 2
- 3
- 4
- 5
- 6
- 7
- 8
- 9
- 10
- 1
- 2
- 3
- 4
- 5
- 6
- 7
- 8
- 9
- 10
代码块
复制 预览
代码块
复制 预览
#train
model.fit(x,y,batch_size=30,epochs=200)
- 1
- 2
- 1
- 2
代码块
复制 预览
代码块
复制 预览
#train data predict and calculate R2
from sklearn.metrics import r2_score
y_train_predict = model.predict(x)*max(price)
y_train = y*max(price)
r2_train = r2_score(y_train,y_train_predict)
print(r2_train)
- 1
- 2
- 3
- 4
- 5
- 6
- 1
- 2
- 3
- 4
- 5
- 6
代码块
复制 预览
代码块
复制 预览
#visualize the data
from matplotlib import pyplot as plt
fig = plt.figure(figsize=(8,5))
plt.plot(price_test,label='price_close')
plt.plot(y_test_predict,label='price_close_predict')
plt.legend()
plt.title('price close')
plt.show()
- 1
- 2
- 3
- 4
- 5
- 6
- 7
- 8
- 1
- 2
- 3
- 4
- 5
- 6
- 7
- 8
代码块
复制 预览
代码块
复制 预览
#save test results to csv
result_y_test = np.array(y_test).reshape(-1,1)
result_y_test_predict = y_test_predict
print(result_y_test.shape,result_y_test_predict.shape)
result = np.concatenate((result_y_test,result_y_test_predict),axis=1)
print(result.shape)
result = pd.DataFrame(result,columns=['real_price_test','predict_price_test'])
result.to_csv('homework9_9_predict_test.csv')
- 1
- 2
- 3
- 4
- 5
- 6
- 7
- 8
- 1
- 2
- 3
- 4
- 5
- 6
- 7
- 8
代码块
复制 预览
代码块
复制 预览
0
提交于 2025-02-22 11:06:43
登录后即可查看更多作业,立即登录
数据加载中...